Background
¶ 1 Leave a comment on paragraph 1 0 Earlier this year, I became interested in work being done by the Equal Justice Initiative. Specifically, the organization had put out a report, Lynching in America, based on research they did to document lynchings between 1877 and 1950. In doing so, they collected data on more than 800 previously unreported lynchings. Using a data supplement and basic text manipulation in Excel, I extracted the state, county, and number of lynchings from the PDF. I then merged this with shapefiles to begin my mapping project. On it’s own, this was not going to be an impressive feat, the New York Times had long since mapped this data.
¶ 2
Leave a comment on paragraph 2 0
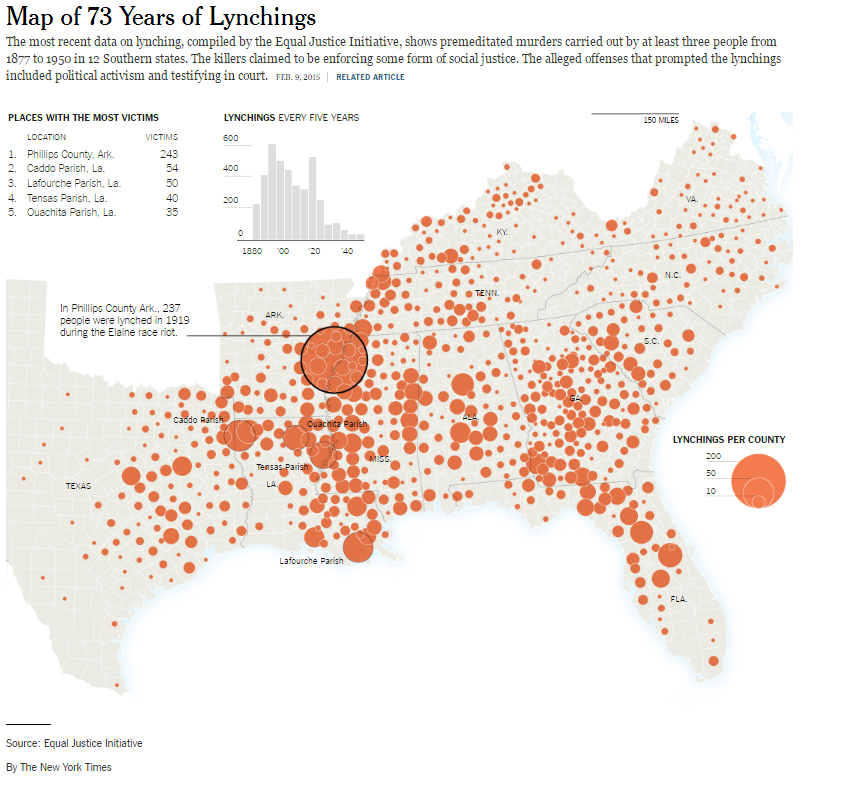 This map highlighted the same things I had noticed: (1) the dramatically high number in Phillips County, AR, corresponding to the deadliest acts of terror during the 1919 race riots and (2) the deadliest parts of the South radiated from the Mississippi river.
¶ 3 Leave a comment on paragraph 3 0 The map is not interactive and has only 2 data points: location and number. To build on this, I would have to find pertinent county-level data, but first I would have to outline what it is I seek to learn.
Toward a research question
¶ 4 Leave a comment on paragraph 4 0 My original intention was to link the lynching data with demographic data from the census, and perhaps data on the Great Migration, to attempt quantifying the terror’s impact on the life course of generations of African Americans. Upon reading about “Thick Mapping” in HyperCities, I realized that any such project would have to go beyond numbers and positivism and include the personal and emotional. This led to frantic searches for data I could link: contemporary police shootings, photographs, newspaper articles, and birth places of notable 20th century African Americans. While not wrong-headed, I realized I had fallen victim to scope creep. This was useful to my thinking about the project, but impractical for a project that is more than a compilation of facts.
Next steps
¶ 5 Leave a comment on paragraph 5 0 In the end, I limited to my data project to the very quantitative. I collected decennial census data on race from 1850 to 1960 from and Social Explorer (go through the GC library to use). I linked the distinct files using SQL in Access (not the best of tools, but it was available to me) and the lynching data.
¶ 6 Leave a comment on paragraph 6 0 I plan to interrogate this data with spatial tools like QGIS and Neatline. I am also asking around for richer data, with at least lynchings by year, from EJI and other projects, to strengthen that ubiquitous x-axis of time (paraphrasing Micki Kaufman).
¶ 7 Leave a comment on paragraph 7 0 I see this project as having the potential to be a powerful teaching resource, even if my plans to reveal demographic patterns do not pan out.
Lessons
¶ 8 Leave a comment on paragraph 8 0 While being interested in the data at hand kept me motivated, it also led me to pursue the project without aim or refinement. In the future, I plan to organize similar projects around exploration, interrogation, and execution.
2 Comments
Eduard: This is an important project though I appreciate how you’ve struggled trying to figure out how to narrow down your inquiry and data collection. I think you’ve touched on an important response to lynching: the strong motivations for African Americans to leave the South and migrate North and West. That Great Migration has three distinct waves: the western migration (to places like Arkansas and Oklahoma) of formerly enslaved people in the Deep South after the Civil War up through the end of 19th century; the first wave of the G.M. (usually younger people and families born after the C.W.) during and after WWI; and the large migration north and west during and after the Great Depression and especially during and after WWII. If you tried to map the out migration of African Americans by county from especially violence plagued southern locations you’d have an interesting mapping project that goes well beyond the NY Times’s effort, however good that was. You might look at Isabel Wilkerson’s recent book on the G.M., The Warmth of Other Suns, for general ideas about the how and where African Americans migrated. Happy to talk more about the historical and conceptual aspects of this project, if that would prove helpful.
Thank you Professor,
Thank you for your encouragement. I really learned about the Great Migration through Wilkerson’s work and narratives. I plan to scour her sources for data, as she mentions a number of things I am interested including the positive selection of migrants and possible sources for data on migration. I think getting it down to the county level will be difficult, but I was thinking I could use the position of railroad lines to make some inferences could work in the absence of good data.
I will take you up on your offer after I make some more progress during the break.