bak.ma is a video collective, an anonymous, autonomous, and open access digital media archive of social movements happening in Turkey. “From Gezi to Tekel workers resistance, 19 January to Hewsel, it aims to reveal the near political history of Turkey with audio-visual recordings, documentation and testimonies.” In other words, it is a way of collecting urban witnesses.
In my visualization project, my principal aim is to present the relationship between space and collective memory through visual testimonies of social movements in Turkey. Since I’m a PhD student in urban studies, I aspire to develop a digital project where one can browse all videos recorded in a city/neighborhood/street, and examine urban temporalities. In this framework, the goal is to set up a map with videos that one can play. Furthermore, the desire is to link videos through particular tags. Hence, one can continue to discover more urban temporalities in other parts of the city/in other cities, and might have the opportunity to conduct comparative analysis.
data set & methodology
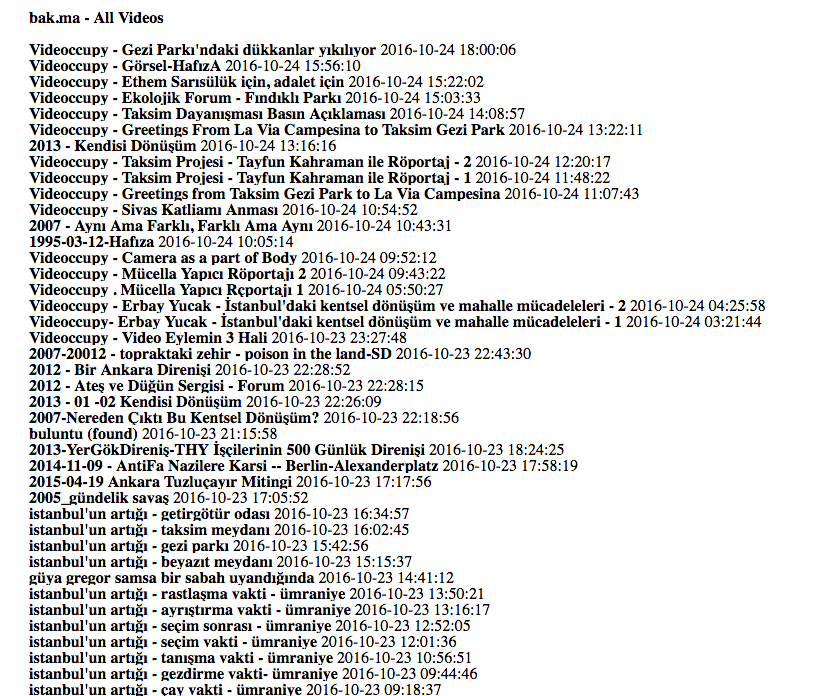
bak.ma is an open to public archive. You can browse images and texts, and play videos without any registration. Signing up/logging in provides you many editorial features, such as uploading, downloading, and editing images, and adding and editing annotations. Indeed, registered users do not have access to get archival data set. Therefore, as a first step of my meta data project, I requested the archival data set from bak.ma via email. Since I know the collective members, it was easy to get in contact, and receive the data set. It is a list of 20 pages in html format, and composed of 1,022 videos.
At first gaze, it was not possible to distinguish the columns/cells in the data set, but it was pretty clear that it has its own logic. In order to discover it, I went back to archive’s website.
On the website, it is obviously seen that archive can be arranged in five dimensions: Date, categories, tags, keywords, and time of day.
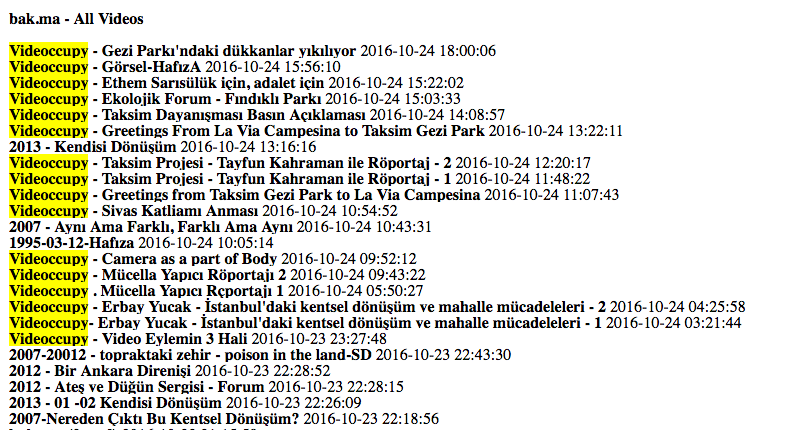
From the html list I chose videoccupy as a keyword, and started to browse archive with the objective of finding its link in the data set: Is it a category, tag, or user name?
On the website, there are 29 videos categorized under videoccupy, but the data set listed videoccupy 18 times; 17 lines starting with videoccupy, and 1 mentioned in the video caption. Meanwhile, I found out on the website that the video is categorized under Gezi. So, through videoccupy keyword, I couldn’t find any direct relationship between the data set in my hand and the archive on the website.
Then I started to view the archive in different forms with the idea of “catching some relations” through different listings: View as list, as grid, with timeline, with clips, as clips, on map, and on calendar.
When I view the archive as a list, I have seen that there are further available data: Title, date, location, tags, language, and duration. Then I went back to my data set, and did a little research for “language”, and the result was null. It does not exist in there.
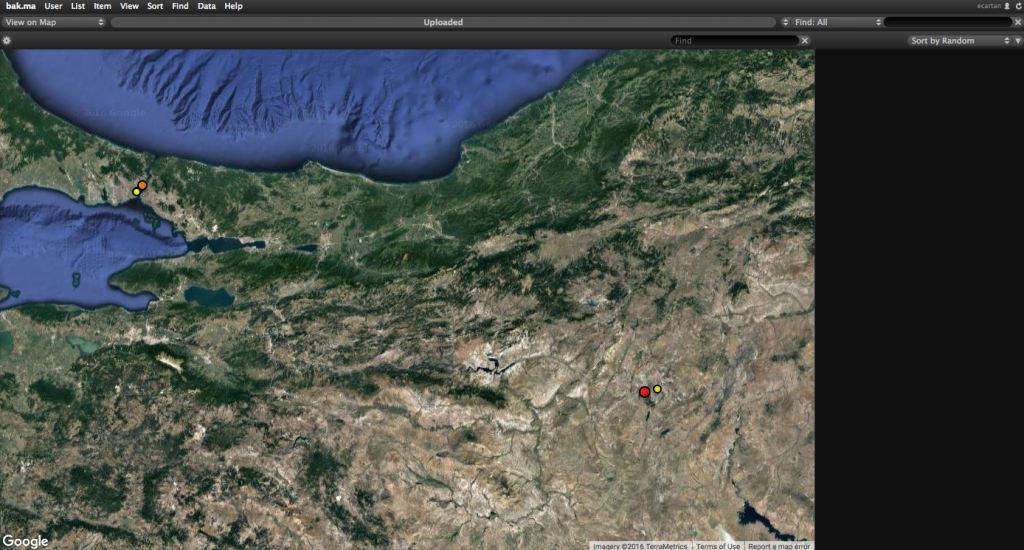
Then I viewed the archive on map, and I came across with a mapping similar to the one in my mind. Indeed, it was not easy to find small dots, as their sizes are directly related to the number of videos recorded in that neighborhood. Especially, finding a few videos coming from the southeastern of Turkey was impossible. And I could not.
As a result, my data set did not work. But meanwhile I discovered what I need to develop a map like the one in my mind: Date, location, and tags. My first plan is to convert the data list in html into xml / csv. I’d probably have to rewrite all data set, because there are two different data sets including the information that I need.
My next question targets to analyze archival practices: The correlation between the date of record and date of upload. I’m aware that bak.ma collects found footages, and upload them regularly. But, what is the frequency of uploading very recent videos of very recent social movements?
Last but not least, I’d be very happy to hear your comments. Since it is partly linked to my doctoral research, any contribution, in terms of research questions and/or tools, will be appreciated.


6 Comments
Somehow in our little chats I missed that your project is on Occupy. That makes it all the more exciting to me. I have a few friends who were in the OWS Archives Working Group, focused on collecting the digital output of the movement. http://www.nycga.net/group-document-categories/the-occupy-wallstreet-archives
I’m sympathetic to your initial negative outcome and all the rewriting you’ll have to do.
Can I librarian you a little more? I have a friend who wrote an article for First Monday: http://firstmonday.org/ojs/index.php/fm/article/view/3845/3280 She was part of the People’s Library at OWS and being a well-funded post-doc at the time (that exists–in the private sector), visited Occupy sites all over the world–maybe even Istanbul??? I’m hunting around for other writings from Jessa. I saw her give a presentation or two on Occupy…
I’m excited to follow your work!!!
Great sources Jenna, thanks very much! Pls feed me more, I’d appreciate any sort of info.
I’ll definitely ask you more about your friends.
E.
Élif, you’ve chosen a challenging dataset to work with that requires acquiring the data, figuring out what the metadata even means, having to figure out what the dates represent, cleaning / regularizing it, and then trying to think about what can be done with it to help advance your own research interests. What’s valuable from your experience has as much to do with what didn’t work as it does with what did. If you haven’t already, I’d suggest taking your dataset in to the Digital Fellows Office Hours or to PUG to work on transforming the html into a table of some form. It might be helpful to hear more detail about the steps you took to map the dataset, as I didn’t see in your list of metadata location names. Let’s talk in future about places to look for help on archival practices. Looking forward to next steps!
Thanks very much for your comment Lisa.
I’ll be at the DF office next Tuesday. Hope we can find a solution to move it forward.
Élif, This is an important AND difficult project. I really like the focus of your research, connecting the Occupy movements in Istanbul and NYC, but as described, I’m not clear where the U.S. piece fits in. Maybe you intend that to come later, after you’ve figured out how to capture and display the video materials from Turkey. In any case, I think figuring out how to display graphically (say, in a .csv file) the metadata about the 29 videos you have found on the bak.ma site would be a good start (for example, using a temporal scale to indicate when videos were shot and try to correlate that to major political moments in Turkey). I am puzzled by where your post ended in the mapping space, though. Am I wrong to assume that the videos are concentrated in a few key cities in Turkey, if not mostly in Istanbul? Yet, the map you chose to use is a topographic map of all of Turkey, which would be a particularly challenging map to display your data on. Wouldn’t a standard Mercator view of Turkey with major cities included be a better choice for your display? Also, given what Chris Sula had to say in class last week about how the NYC police were interested in his mapping of Occupy groups, do you have any concern about how the Erdogan government might make use of your mapping project? if so, that could pose problems for making your data public. Just a (political) thought.
Hi Steve,
Thanks a lot for your comment. Actually, and unfortunately, the comparative study between NY and Istanbul would be held in a very conventional way of dissertation writing. Here, in the metadata project that I proposed for #dhpraxis16, I want to work on a project which is partly involved to my research, or which can be a following step of my doctoral research in the future. I’ve also noticed that I didn’t explain clearly, all the images that I’ve posted above are taken from bak.ma’s website. They have also a feature called “view on map”, but, like I said, it doesn’t function properly. Moreover, bak.ma is built on an open access media archive program called pan.do/ra, and I have to check this mapping function with the program developers. But you are right, topographic map is hard for users. And security issues… There are different opinions about it, like it was mentioned by Chris also, and it’s definitely one of the core parts of my doctoral research. One side argues, these images are publicly available, and no harm to collect, archive, and share; and other side disagrees by saying, sharing with public doesn’t mean to become directly a part of an archive. But in the case of bak.ma, for example, users are uploading images by themselves. So I can say that it’s still a blur area. Hope I’ll discuss it better in my dissertation.