Content Strategy: Removing the Artist for the Sake of Delivery

The sound of one hand clapping is fantastic for the originator: it requires a single point of origin, and a lack of interaction with the other hand. However, the sound of one hand clapping doesn’t make ends meet when you weigh artistic drive versus business need. One of the key takeaways from Erin Kissane’s The Elements of Content Strategy deals with the idea of sustainable content. According to Kissane, “sustainable content is content you can create – and maintain – without going broke” and one of the most important elements that can be extrapolated from that section is that the necessity of artistic drive shouldn’t outweigh the needs of a business or project to sustain itself. The sound of one hand clapping deals with an editor or producer creating content with an absolute subjective voice. The content relays information from the perspective of the subject rather than an objective entity, which could render the delivery subject to misinterpretation or worse, boredom for the enduser. Read More »

Posted in Student Post, Uncategorized | Comments closed

Data Project: Female Writer Metadata in Wikidata

The unsatisfactory representation of women on Wikipedia has received much attention in recent years (such as here). Specifically, a dearth of coverage of women, as well as bias within the Wikipedia articles on women that do exist, have both been observed. This issue has been connected to the low percentage of female Wikipedia editors; according to the article above, 84-91% of Wikipedia editors are male. In particular, Wikipedia’s inadequate coverage of female writers has been highlighted. Although measures have been taken to combat this general lack of representation, it remains a problem.

This representation issue extends to Wikipedia’s linked data-related counterparts, DBpedia, which extracts linked data from Wikipedia articles, and Wikidata, which supplies data for both the public at large and Wikipedia articles themselves. Interesting analyses of Wikipedia’s linked data initiatives are already being done. For example, the Wikidata Human Gender Indicators project has examined the intersection of gender and other aspects such as occupation, country, and ethnicity in Wikipedia biography articles and makes their findings available as an open data set. This group also updates their data continually in response to Wikidata updates. Due to my great interest in linked data, I wanted to explore the area of gender treatment in Wikipedia’s linked data initiatives further. In particular, I wished to examine not only Wikidata’s coverage of women writers but also the depth of existing Wikidata entries on women writers, as analyzed through the lens of the metadata used in these entries.

I chose to do so using query language and a publicly accessible tool provided by Wikidata. I learned the basics of SPARQL (SPARQL Protocol and RDF Query Language), a query language developed specifically for querying linked data, which is in the form of RDF, during a professional development course for librarians that I took this summer, and I was able to further practice query language (specifically MySQL) in the two Digital Fellows workshops I attended at the beginning of this semester: Databases Part I: Introduction to Data Management with Databases and SQL and Databases Part II: Querying in the Real World. Although some linked datasets must be queried using a command line tool or other tool separate from the database, some dataset providers, such as Wikidata, provide access to a SPARQL endpoint. Wikidata’s SPARQL endpoint, Wikidata Query Service, provides a user-friendly interface for entering query language to explore Wikidata in its entirety.

I constructed and ran a series of SPARQL queries to first of all see for myself the extent of Wikidata’s current coverage of women writers and then delved into specific properties used in the entries on women. Before beginning to explore the data formally using SPARQL, I looked through the Wikidata pages for well-known writers to get a sense of what properties were commonly used and examined Wikidata’s properties browsers, which allowed me to gain exposure to the extensive number of properties used on Wikidata. I referred to these resources throughout the querying process. In particular, I searched for the following properties in articles on both women and men writers: “notable works,” “described by source,” “archives at,” “genre,” “list of works,” and “influenced by,” all of which I believe represent valuable writer data. I used multiple queries so that I was able to see, for each property, the percentage of articles among each gender/sex category (a single property is used for gender and sex on Wikidata) in which at least one instance of the property was present as well as the percentage of total instances of the property among each gender/sex category. Once I finished each query, I used the export option to view and manipulate the data in Excel. Result sets are displayed on the screen and can be exported in CSV and other formats. Despite using query language aimed at the elimination of duplicates, I sometimes had to remove more duplicates from the exported data in Excel.

In one sense, my results were what I expected, in that I found there to be far more articles on male writers (including transmen writers): 99,695 as opposed to the 27,134 I found for female writers (including transwomen writers). In terms of each of the specific properties analyzed, although the percentage of total occurrences of the property among each gender/sex category and the percentage of articles among each gender/sex category that had at least one occurrence of the property were higher for men for four of the six categories, they were higher for women for two categories (“notable works” and “archives at”), indicating that these metadata categories were slightly richer for articles on women writers. However, it is important to note that the percentages were quite low overall; there are perhaps more relevant properties that are often used in Wikidata articles on writers on which I could have focused.

The dataset, tool, and methods outlined here have some strengths: notably, the structured nature of the data and the user-friendliness of the SPARQL endpoint, both of which ease the data exploration process. However, this project is rife with limitations as well. First, SPARQL endpoints are not always completely accurate and reliable. For example, the use of these endpoints sometimes results in long delays if the result set is large or the query complex. I had to go through a number of queries before finally using a simple count query that returned the number of male writers in Wikidata. All of my initial queries resulted in the message “Query timeout limit reached” because the result set was so large. Another challenge is that Wikidata content is constantly changing. I noticed slight changes in my search results over the space of the few days during which I did my queries. Regarding the dataset itself, it’s difficult to know for certain whether the absence or presence of some of the properties in the articles (such as the “archives at” property) are indicative of real-world deficiencies. Additional datasets would have to be consulted in order to explore this.

Additionally, my querying skills admittedly could use some improvement; developing better skills in this arena could perhaps allow me to carry out more complex and interesting queries. Also, this is not highly original work – as mentioned above, others have already done great work with this and similar datasets. I also stopped after only an initial exploration of the data. Much more could be explored in terms of not only additional data points but also visualizations and so forth. On a more personal note, this project has strengthened my resolve to participate in future linked data-related initiatives. While looking through the query results, I noticed a number of articles in need of improvement.

Posted in Uncategorized | Comments closed

Tableau Public Workshop | Lower East Side Librarian

My experience with Tableau Public (TP) may be colored by the fact that I am annoyed by its free-as-in-beer-for-some-people-and-not-at-all-free-as-in-speech status and the fact that you have to log in every step of the way. I dutifully created an account on my computer and downloaded the software, but when I tried to launch it, I got an error message:

To keep reading, go to: Tableau Public Workshop | Lower East Side Librarian

Posted in PressForward, Student Post, Uncategorized | Comments closed

Mapping Terror: Lynchings and Demography

Background

Earlier this year, I became interested in work being done by the Equal Justice Initiative. Specifically, the organization had put out a report, Lynching in America, based on research they did to document lynchings between 1877 and 1950. In doing so, they collected data on more than 800 previously unreported lynchings. Using a data supplement and basic text manipulation in Excel, I extracted the state, county, and number of lynchings from the PDF. I then merged this with shapefiles to begin my mapping project. On it’s own, this was not going to be an impressive feat, the New York Times had long since mapped this data.

nytimesejiThis map highlighted the same things I had noticed: (1) the dramatically high number in Phillips County, AR, corresponding to the deadliest acts of terror during the 1919 race riots and (2) the deadliest parts of the South radiated from the Mississippi river.

The map is not interactive and has only 2 data points: location and number. To build on this, I would have to find pertinent county-level data, but first I would have to outline what it is I seek to learn.

Toward a research question

My original intention was to link the lynching data with demographic data from the census, and perhaps data on the Great Migration, to attempt quantifying the terror’s impact on the life course of generations of African Americans. Upon reading about “Thick Mapping” in HyperCities, I realized that any such project would have to go beyond numbers and positivism and include the personal and emotional. This led to frantic searches for data I could link: contemporary police shootings, photographs, newspaper articles, and birth places of notable 20th century African Americans. While not wrong-headed, I realized I had fallen victim to scope creep. This was useful to my thinking about the project, but impractical for a project that is more than a compilation of facts.

Next steps

In the end, I limited to my data project to the very quantitative. I collected decennial census data on race from 1850 to 1960 from and Social Explorer (go through the GC library to use). I linked the distinct files using SQL in Access (not the best of tools, but it was available to me) and the lynching data.

I plan to interrogate this data with spatial tools like QGIS and Neatline. I am also asking around for richer data, with at least lynchings by year, from EJI and other projects, to strengthen that ubiquitous x-axis of time (paraphrasing Micki Kaufman).

I see this project as having the potential to be a powerful teaching resource, even if my plans to reveal demographic patterns do not pan out.

Lessons

While being interested in the data at hand kept me motivated, it also led me to pursue the project without aim or refinement. In the future, I plan to organize similar projects around exploration, interrogation, and execution.

Posted in Uncategorized | Comments closed

Guest Editing at Digital Humanities Now While Mourning the 2016 U.S. Presidential Election

I spent a particularly difficult week as a volunteer editor-at-large for DHNow. As I write this blog entry, I have gone through several stages of grief in light of Donald Trump’s election. Earlier this year, my family and I took citizenship oaths and were thrilled to be living some form of the American Dream. The excitement of casting my first vote on Tuesday afternoon was soon replaced by shock, denial, and bargaining Tuesday evening. Waking up on Wednesday morning, I felt like I was reliving the feelings I had as an adolescent brown person in New York after 9/11. My mother is a nurse who has coworkers married to cops who advised my father, a traveling physical therapist, to shave his beard to avoid being perceived as being a terrorist. It’s been 15 years and this week I’ve been battling similar feelings of fear, anxiety, and inefficacy at the knowledge that the president elect came into power with messages and endorsements of misogyny, homophobia, and xenophobia.

Although I was too dazed and distraught to participate, I am grateful to Dr. Brier and Dr. Rhody for forgoing our scheduled topic in order to allow our class to share our thoughts and feelings on the day after the election. During this past week, I attended a rally at Washington Square Park. I also attended the event “Process/Mourn/Activate” at the Brooklyn Museum hosted by BUFU and the Yellow Jackets Collective. Before breaking up into groups for artists, researchers, healers, and musicians, the hosts set up some ground rules involving checking our privilege, checking and respecting people’s boundaries and identities, and centering the voices of people normally marginalized. I heard a young woman in a beret confess that she and her friends no longer feel safe wearing hijabs. I spoke with some journalists and filmmakers of color who shared in my anguish at the election results. At the same time, we kept in mind another point emphasized by the organizers: “Trauma begets trauma. We’re here to share our skills and resources.”

All of this is to say, my judgment and curatorial choices as volunteer editor-at-large for Digital Humanities Now were very much informed (clouded?) by the trauma of the beginning of the week. Like Gregory, I read and referred to  Jenna’s excellent guide on PressForward during my stint as volunteer editor-at-large at Digital Humanities Now. The seemingly endless stream of content I faced was less daunting having her tips to refer to. Fortunately, we were already familiar to the PressForward through our blog. The only difficulty I had with the site was how slowly the stream would load and refresh in dashboard view. In looking at this stream of material, I was struck by how different it was from the curated content of the feed on my news apps or my Facebook which I’m aware is mediated to keep my (determined) interest.

In nominating content, I tried to select material that would be of interest in light of our readings, discussions, and recent un-ignorable events. Our discussion in the last class touched on how to move forward as DH practitioners, how to become and remain politically engaged and to do work that has relevance and serves as a public good.

Although I am not a teacher, this is an excellent article which promotes the encouragement of humility and support rather than competition in mentorship. Estee Beck and Mariana Grohowski also espouse an ethic of care inspired by feminist philosopher Nel Noddings which “assumes the position of reflectivity, not necessarily reciprocity” echoing the position we were encouraged to assume at “Process/Mourn/Activate.” Janine Morris’s “Watson Session A3: Mobilizing Digital Feminist Rhetorical Theory and Practice” discusses several presentations how we can engage with technology while practicing self-care, reflection, and rhetorical listening. Among the presentations discussed is Kristin Ravel’s “Ethics and Digitality: A Feminist Rhetorical Approach to Social Networking Spaces” which discusses how our social media feeds are mediated and mediate us and urges a valuing of emotional labor. She also summarizes Allegra Smith’s “Please Internet Responsibly: Rhetorical Feminist Methodologies for a Digital Age” which outlines a way of engaging with the internet so that one does not simply cement existing power relations but reflect critically. Her discussion of Smith’s methodology in her research on the male gaze in pornography is a great example of embodied research: Smith recorded herself responding to the videos she discusses in her text.

I also nominated two articles discussing Pokémon Go. In “Beyond dinosaurs and Pokémon Go: how AR is being used to deliver enhanced educational experiences“, Matt Ramirez discusses the potential of augmented reality features in the fields of archaeology and music production and alludes to its capacity for educating beyond. In “The 2016 Election as Casual Game: Pokémon Go, FiveThirtyEight, and the Paradoxes of the Quantified Citizen“, Elizabeth Losh discusses her participation in the seduction of digital dreamscape provided by Pokémon Go (which dissolves gender, ethnic, and class lines) while simultaneously examining the relationshipbetween game theory and political process. These discussions echo a sentiment attributed to Jane Mcgonigal by the members of the panel discussion, “Preserving the Creative Culture of the Web” that video games have the potential to solve–and I would add conceive of– our world’s most pressing problems.

By now I’ve read endless reflections on and examinations of the election and how it came to pass. I decided to pass forward (PressForward?) texts that have given me some purpose and direction as a student of DH. Two projects I encountered on Digital Humanities Now, Early African American Film and  Ellas Tienen Nombre illustrate how DH practices can serve to make witnesses of practitioners and audiences to historical events. The Internet Archive is currently calling for submissions to build the  2016 U.S. Presidential Election Web Archive.

Posted in Uncategorized | Comments closed

My week as editor for Digital Humanities Now

Being an editor for Digital Humanities Now has been very good, for me, to experience with digital tools and digital editing. Moreover, working on it during the Election Week – and its results – has been also a good way to forget (or, at least, try to forget) what has just happened (a lot of contents were analysis of the election, even if not all of them related to digital).

As the other editors before of me already posted on this blog, the amount of work required is not excessive: because other people before of me already explained how to nominate different contents, I will not repeat it again here. I will, instead, point out which parameters I followed to orient myself into this stream of different contents. I tried to maintain a homogeneous and coherent approach in my choice, and this was related to what the Digital Humanities are for me: as our course is continuously proving, the DHs are an approach, open to different academic disciplines, based on the use of digital tools for the study of these disciplines. For this reason, I nominate contents related to this wide approach, instead of others limited to specific areas or events or news. In other words, I looked at the theoretic and general content of the posts, and for this reason I didn’t consider job advertisements, call for papers, links to blogposts, announcements of new journal issues, book reviews, and slides.

Starting with the 2016 Presidential Election, I nominated a project based on the collaborative approach which caracterized the DHs: it is the request to help in building the 2016 Presidential Election Web Archive. Instead, talking about maps, Ellas Tienen Nombres is a Mexican project which has mapped the continuous murdering of women in Ciudad Juarex, Mexico, building an interactive map such as the ones listed in HyperCities project.

Other contents I nominated referred to specific software or tools relevant for a DHers community. For instance, this one explains a new feature of Mallet, the software I employed for my data project; this other contains useful information about the new possibility given by oaDOI to find the open version of academic papers and other resources; here we can find information about the new version of Omeka, the content management system for scholarly projects; and, finally, the Blake Archive shows how TEI could represent the ‘metamarks’ (“marks such as numbers, arrows, crosses, or other symbols introduced by the writer into a document expressly for the purpose of indicating how the text is to be read. […] a kind of markup of the document, rather than forming part of the text”) in digital editions of manuscripts.

I also nominated contents related to specific digital projects worth to be known. For instance, this post deals with the employment of Artificial Intelligence – a tool previously employed for games such as the most recent Pokemon Go – for education, while other two are both focused on the word ‘count’. The first– about the works of the DigiWriMo (Digital Writing Month) – wonders if the number of words written in a digital projects are relevant, in other words if they count, to define the quality of these projects (the title is indeed about the horrors and pleasures of counting words). This other, instead, is a reflecion about how digital projects could count as scholarship (the author – Matthew Delmont – mentions his project Black Quotidian, aimed to map references to black cultures on newspapers). Finally, the Online Repertory of Conjectures on Catullus offers to scholars and students a digital edition of all the poems written by the Latin poet, very useful because digital tools allow to browse the text.

These were some of the contents I nominated because I found them relevant for the DHers community: each of them, referring to different projects, shows the potentiality offered by the employment of digital tools.

Posted in PressForward, Student Post | Comments closed

Data Project: Crime Rates in NYC Public Schools

For my project, I focused on the number of different crimes in New York City public schools. View the results of my project (including my blog post about it) at my website and view the Github repository with the resulting CSV files and Python script.

Please leave any comment here. I’d love to have anyone with more data analysis experience critique my method.

Posted in Student Post | Comments closed

DH Praxis Seminar – Data Project: A Queer Topography of Weimar Berlin

In one of my other classes this semester (Women, Gender and Fascism in 20th Century Europe), I am exploring the topic of how Weimar Berlin (1918-33) profoundly shaped urban homosexual aesthetics and identity. Urban life enabled social outsiders—such as female and male homosexuals—to not only create, but also define their own space, identity and narrative.

Historical consciousness of the Holocaust and Nazi Germany is dominated, in part, by the museums around the world that serve as memorials for the victims of Hitler’s regime, of World War II, and the violent politics of eugenics and racial purity. Though these museums and memorials serve to preserve a piece of history, they also seek to engage visitors in the present. Gay and lesbian subjects have been relatively absent in both historical consciousness and Academia. Queer history, an interdisciplinary field that goes beyond the study of ‘gays’ and ‘lesbians’ as historical subjects, has been even more absent. Thus, I strongly believe it is important to approach this topic through a queer lens and examine historical events taking gender and sexuality as the central considerations for evaluating institutions, aesthetics, and discourse.

Therefore, a topography of pre-Nazi Berlin that defines the character’s sexuality and gender performances is essential to gain a better understanding of the outcome of the Holocaust when it comes to discussing historical memory. In this case, I am interested in using GIS software to create a map of Berlin from the 1920s that can illustrate certain homosexual topoi. In order to do so, I will work with QGIS.*

To begin with, I will need to obtain all the shapefiles required for this project. In the first place, Natural Earth, a website created by volunteer contributors and supported by the North American Cartographic Information Society (NACIS), provides cultural, physical and raster data at a large, medium and even small scale. For my purposes, I will take advantage of one of the large scale (1:10m) raster layers for the background of my map—in other words, an actual map of the world. Next, I will have to add several vector layers containing geographical data of contemporary Berlin in order to illustrate, at least, its rivers, streets and buildings. Geofabrik, a German company that offers OpenStreetMap consulting, provides both .osm and .shp files of all sixteen federal states of Germany. In addition, BBBike, a cycle route planner for more than 200 cities worldwide, might also be a useful site to acquire free open-source extracts of Berlin and Brandenburg.

As I introduced before, I intend to combine this modern map with a historic map of Berlin from the 1920s. Since, in this case, I will just use a JPEG image, I can easily obtain one, for example, from Old Maps Online, a collaborative project between Klokan Technologies GmbH, Switzerland and The Great Britain Historical GIS Project based at the University of Portsmuth, UK. To configure the design that I have in mind, I will have to overlay the historic map image of old Berlin and georeference it; that is to say, associate points on the historic map image with points on my vector map. QGIS has a ‘Georeferencer’ plugin that I will have to download, but that definitely facilitates the process. Once this part is over, I will just have to document the spots I am interested in and highlight those on my map—with either points, lines or polygons.

Berlin has long been identified as a ‘sexy space’, ‘El Dorado’ by homosexuals in the Weimar Republic. However, the City and its homosexual ‘sexy spaces’ included much more than bookstores, bars and nightclubs. Weimar Berlin bridged and overcame social opposites, and without doubt became an affirming setting of sexual agency and identity. Thus, historical memory work can be a powerful tool to fill gaps in understanding, challenge dominant beliefs.

Two of the sources I will use to locate and illustrate these spaces on the map are “We Will Show You Berlin: Space, Leisure, ‘Flânerie’ and Sexuality”** and “Defining Identity via Homosexual Spaces: Locating the Male Homosexual in Weimar Berlin”,*** both by David James Prickett, head of the English/Philology Department at the Center for Languages and Core Competencies at the University of Potsdam. On the one hand, Prickett explores the conceptualization of Berlin as space, leisure, flânerie and (homo)sexuality through the analysis of Klaus Mann’s The Pious Dance: The Adventure Story of a Young Man (1926) and Curt Moreck’s Guide Through ‘Naughty’ Berlin (1931). On the other hand, in an effort to determine how homosexual spaces defined male homosexual identity, Prickett also analyses Magnus Hirscfeld’s Sex and Crime and Friedrich Radszuweit’s Male Prostitution in Wilhelmine Berlin.

I am sure there is plenty more bibliography concerning homosexual aesthetics and the streets of Berlin. If anyone has any suggestions, I will be very pleased to hear them and take them into consideration for this digital history project.

* For those of you not familiar with it, QGIS is a cross-platform free and open-source desktop geographic information system (GIS). (The Wikipedia definition of ‘QGIS’ turns out to be pretty helpful here.)
** Prickett, David James. “We Will Show You Berlin: Space, Leisure, ‘Flânerie’ and Sexuality.” Leisure Studies 30.2 (April 2011): 157-77. Web.
*** Prickett, David James. “Defining Identity via Homosexual Spaces: Locating the Male Homosexual in Weimar Berlin.” Women in German Yearbook 21 (2005): 134-62. Web.

Posted in Uncategorized | Comments closed

Short is better? Analyzing the ‘participate reception’ of a text

The data set I chose for my project is a collection of tweets, produced during Summer 2015 for #LabExpo, an experiment on Twitter proposed by the Italian start-up TwLetteratura connected to Expo Milano 2015. This experiment is based on the methodology developed by TwLetteratura, which takes advantage of Twitter’s peculiarities (synthesis, sharing, real-time interaction) to involve readers in a text: TwLetteratura establishes a schedule and defines a hashtag; everyone is invited to tweet, commenting, interpreting, or analyzing the text; the only rule to be respected is to follow the schedule and to insert the hashtag. Employing Twitter produces a ‘participate reception’ of a text: a new kind of reception which, differently from the traditional one, implies an explicit action by the readers. I have analyzed these tweets by using Mallet, to understand how people absorb and re-interpret the text.

#LabExpo
#LabExpo started on July 13 and ended October 11, 2015: the text to comment was the Science Agreement, a scientific document written by scholars from more universities and research institutes all over the world in collaboration with Fondazione Giangiacomo Feltrinelli, which established the scientific program of Expo 2015. TwLetteratura defined six thematic shots to debate on, related to six passages of the document, each dedicated to a specific issue. Each of them has to be tweeted with the hashtag #LabExpo, followed a key word: #LabExpo/foodsec for Food security; #LabExpo/commons for Collective goods; #LabExpo/energy for Access to energy; #LabExpo/innovation for Tech and social innovation; #LabExpo/foodscape for Food and identity; #LabExpo/foodprod for Sustainable processes for food production. The passages were published both in Italian and in English on the websites of TwLetteratura and Fondazione Feltrinelli.

The tweets
I collected the tweets produced for #LabExpo using Blogmeter, a social media collector platform which monitored #LabExpo by counting all the tweets containing the hashtag. The participants produced a total amount of 4,435 messages, counting both tweets and retweets (1,500 tweets), written by 130 users (the total amount of whom, counting also who retweeted at least one tweet, is 795). The tweets could be analysis, interpretation, comments to the text, and contain other kind of data different from written text (pictures, videos, links). All the tweets were stored in Blogmeter, and I downloaded in a .xls file format; they were listed following these parameters: link to the original tweet; content of the tweet; author; date.
To analyze their content for my project, I employed Mallet, a “Java-based package for statistical natural language processing, document classification, clustering, topic modeling, information extraction, and other machine learning applications to text”: I want to thank you JoJo for having provided my a very useful tutorial, because I am not an expert of data analysis and I have never used Mallet before.

First of all, I created a .txt file from my .xls file containing all the tweets: Mallet could analyze only .txt. After that, I asked Mallet to analyze the file limiting the number of topics to 20, enough to have a clear situation of the trend. Moreover, I included also the command –optimize-interval, so the final file contained also an “indication of the weight of that topic” (as the tutorial states). The result was a .txt file, which I exported into a .xls file, obtaining this:

labexpomallet

On the first column (A), numbers 0 to 19 identify the topics; on the second column (B), the weight of each topic; the remaining part, the content of the topic.
Unfortunately, Mallet apparently does not recognize Italian language, and the majority of the tweets were written in Italian; so, the topics contain also words without a semantic meaning, such as article or preposition. Mallet has instead a specific command to exclude this kind of information from texts written in English.

I will consider now the 4 most relevant topics, and the data they contain.
– Topic 3: “twitter”, “labexpo”, “foodscape”, the hashtag employed to comment the section of the text related to Food and identity, “accesso” (access), and “cultura” (culture).
– Topic 6: “commons”, “nutri” (feed, related to Expo payout “Feed the planet”), and “innovation”.
– Topic 1: “foodsec” (hashtag for the section about Food security), “energy”, “alimentare” (food), “foodprod” (the hashtag for Sustainable processes for food production), and “scienza” (science).
– Topic 10: “dibattito” (debate), “temi” (argument), “cibo” (food), “discutiamo” (discuss), “nutriamo” (feed), “mondo” (world), “collettivi” (commons), “sviluppo” (development), and “ricercatori” (researcher).

Even if these data could have only a statistical meaning, based on their frequency we could have a more precise understanding of some trends of the project. For instance, the relevance of “foodscape”, “foodsec”, “foodprod” suggest that these sections of the text were the most tweeted: here, readers felt more involved or they were most interested in. It is also relevant to find words in English, such as “innovation” or”commons”: this witnesses the international character of the project. Finally, the presence of words from the same semantic/thematic area seems to prove that participants understood the purposes of the project: to make people aware of the sustainability of the production of what is necessary for men today. This is relevant especially with words related to food.

This analysis allowed me to understand some trends which could be applied to understand how users participate to the project; this is also a first approach, and I would like to deepen it taking advantage of Mallet’s opportunity.

Posted in Student Post, Uncategorized | Comments closed

Dataset: The Roosevelt Store Ledger

In the first years of the American Republic, James J. Roosevelt started a business that would eventually, under his son, became the largest importer of plate glass in the country. At first, it was just a store, and the merchandise was general in nature though certainly related to building construction and decoration. Two related items, a ledger or account book, and its associated alphabet or index, hint at the story of this enterprise in lower Manhattan. In use from 1792 until at least 1814, the Roosevelt store ledger recorded the transactions of the company, and now provides a glimpse in to business life in Manhattan and the expansive reach of commerce.

The Store
The first Roosevelt store was located at 42 Maiden Lane; a 1793 newspaper announcement advertised, “a large and elegant assortment of looking glasses,” along with patent lamps, paper hangings, wine glasses, and, “other articles.”[1] By 1795, the store had moved to 102 Maiden Lane, between Pearl Street and Gold Street, where it would remain for decades.[2] Because the street addresses in parts of lower Manhattan were re-numbered, the current address of the building that housed the Roosevelt store is 90-94 Maiden Lane. Landmarked in 1989, the cast iron front building contains some elements of an earlier building, dating from 1810.[3] A 1809, a fire in the store, described by a news account as a, ‘looking-glass and paper hanging store,” likely inspired this construction effort.[4] When Maiden Lane was widened, in 1822, part of the building was removed, and a Greek Revival façade was added. The cast iron front was added after the Civil War, long after James’s 1840 death.[5]

The Books
The Roosevelt store extended credit to its customers, and record the transactions in a large ledger book, based on the “Italian Style” of book-keeping.[6] A typical entry in the ledger includes the customer’s name and the dates of their transactions with the store, including a debit and a credit column. A typical entry in the ledger includes the customer’s name and the dates of their transactions with the store, including a debit and a credit column. For few entries is there any indication of the goods purchased, generally only the amount of money is given. In some entries the address and occupation of the customer is noted. The customers appear to have been local, for the most part, though there are some from farther away places, Albany, Troy, and locations in New Jersey and Massachusetts, and abroad.

When the ledger was started in 1792, each entry was given its own page. This is evidenced by the different, and now less legible, ink used in these entries, on the top of the pages, as well as their early dates. As the use of the book continued, other accounts were entered below the existing ones, but in no particular order. So, at some point, an index or alphabet was needed to locate individuals in the ledger. As the the ledger today is incomplete, with only a front board, covered in leather, and its first 230 numbered pages, this index provides important added information.

The soft bound, or paper back, book that became the alphabet, or index, was apparently crafted after 1802, with a marbled paper cover, backed up by an extra sheet from New York printer George F. Hopkins’s edition of The Federalist.[7] Though it is not visible in normal use, carefully pulling apart the two layers of the wrapper, reveals the end of Number 76, “The Appointing Power of the Executive.” Pasted on the inside cover of the alphabet is a label from T.B. Jansen and Co., stationary and book store, at 248 Pearl Street.

Entries in the alphabet are arranged alphabetically, by surname, and include the customer’s last name, first name or initial, and the page number in the ledger where that account can be found. Occasionally a person’s occupation or address is listed. Not all of the people in the ledger are in the alphabet. It appears that earlier customers, perhaps ones no longer doing business with the store, were left out when the alphabet, or index, was created, which was at least a decade after the ledger went in to use.

The Transcription
Information from the index was extracted first, for ease of use. The details from the ledger then added, with anything extra from the index indicated. So, while it started with the index, the ledger is the main focus. The original order of the names in the ledger has not been preserved. (This relates to the original intention of the transcription project vs use as a data set, outlined later.) The main data transcription includes only those customers on the existing first 230 pages of the ledger book. The names of those in the subsequent pages can be gleaned from the alphabet, but without additional information, and will not be used for this DH dataset project, probably.

The extracts provide the basic details of the entry from the ledger, leaving out the monetary amounts. Not all entries contain all information, and occasionally odd pieces of information, like, “married Sally Smith”, are included, in the column usually used for residence or occupation. The order of the information, as available, is as follows:
Surname, first name; occupation; residence, dates active with the store, page number in the ledger.

The Dataset
I have been transcribing the Roosevelt ledger book, off and on, for some time. Originally, my intention with the transcription/extract was that it would be published somewhere, a journal perhaps, in a traditional print manner, to offer the information to scholars and other interested people. I started by using Excel as a way to collect the information, but would have exported the data to a text file of some kind, for publication. In thinking about a dataset to use for this class project, the ledger was not my first thought. But after looking around at other available datasets, and exploring the different projects we have seen in class, it occurred to me that the ledger might offer some fun and interesting possibilities.

Because I started with the idea of traditional publication, I followed the guidelines of documentary editing, historical, and genealogy publishing, which dictate that the information is transcribed as it is presented. Some of this might present challenges in using digital tools to explore and share the data. For example, Pearl Street is frequently spelled as Perl, but also as we are used to it today. These kinds of things will need to be reconciled, or standardized, if I am to use mapping tools, though I may not know to what extent until I really get into the experimenting.

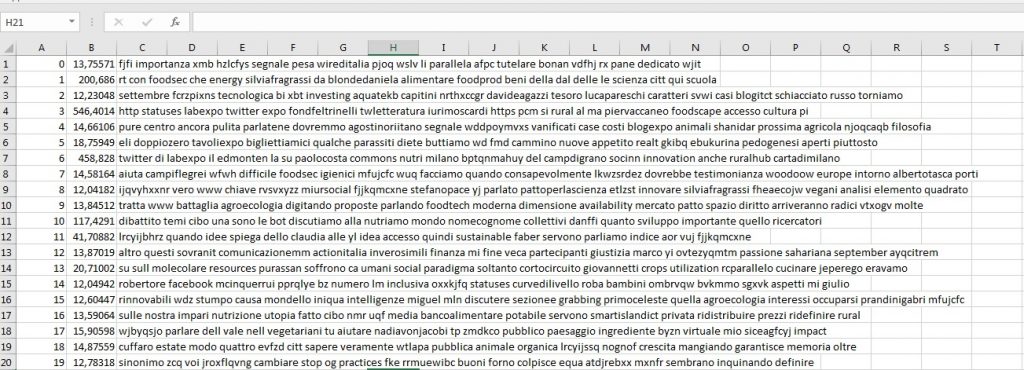
I am including, as an example, a part of the dataset, but I am still working on it, still transcribing. It is unlikely that I will transcribe all of the ledger book before the end of the semester, but I should have a large enough sample to see what kinds of things might be possible. I have attempted to tidy up the data, so that it might be useful for digital tools. One change from the ‘print ready’ version is that I have altered the way I am expressing dates.

Previously I had dates (years only) in two columns; the first listing multiple years that the customer was charging items to their account, and the second for years they repaid the debt. In some cases, this meant that columns included five or six different years. In the data for this project, I have two columns representing the range of years a person was interacting with the store. So the first year they interacted with the store in one column, and the last year in another. This is less data than I would include in a true transcription/extract but seems cleaner.

To take one example, the entry for Joel Atwater from my original transcription would look like this.
[name]           [residence]                      [years – acts charged] [years – accts paid]   [page]
Atwater Joel   Derby Connecticut     1796, 1799, 1809, 1812          1797, 1811-1812   141

The same entry from my DH dataset project version looks like this.
[name]             [residence]                    [1st year active] [last year active]   [page]
Atwater Joel   Derby Connecticut     1796                    1812                      141

As I continue to transcribe the data I will include all of the dates, as in my original transcription. In this way, I will have a larger set of information, should I change my mind and decide that I want to use all of the dates in my DH project.

There are other pieces of evidence from this era, like city directories, that might offer complementary data, and could be included in analyzing and using this data. But just the Roosevelt book alone is something unusual. A city directory will tell you about the joiners, or guilders, in the city, but the ledger book actually demonstrates the way that the artisans and consumers of Manhattan, and beyond, were interconnected. It also shows that the range of people involved in commerce was different than what the city directory, or a census enumeration, might indicate, as it includes people that might be otherwise invisible. This highlights, for me, the difference between presenting the data, alone as an effort to convey information, and the actions involved in using it, or interpreting it, to say something about another era.

[1] The Daily Advertiser (New York, New York) 24 May 1793, p. 1; www.genealogybank.com.

[2] Longworth’s City Directory of New-York, 1795, p. 183; www.fold3.com.

[3] NYC Landmarks Preservation Commission. “90-94 Maiden Lane.” [Designation report] New York, 1989.

[4] “Yesterday Fire Maiden Lane” New-York Gazette (New York, New York) 11 February 1809, p. 3; www.genealogybank.com.

[5] New-York American (New York, New York) 18 August 1840, p. 3; www.genealogybank.com.

[6] Dilworth’s Book-Keeper’s Assistant (1803)books.google.com . Dilworth’s taught the basics of the “Italian Way” of stating credit and debtor, the method, used by Roosevelt in his ledger book.  Copies of this book were sold by T.B. Jansen, the stationer and bookseller, where Roosevelt purchased the book used for his alphabet, or index, to his ledger.

[7] Publius. The Federalist, on the New Constitution (New York, George F. Hopkins, 1802).


roosevelt-ledger-dh


Posted in Uncategorized | Comments closed
  • Archives

  • Welcome to Digital Praxis 2016-2017

    Encouraging students think about the impact advancements in digital technology have on the future of scholarship from the moment they enter the Graduate Center, the Digital Praxis Seminar is a year-long sequence of two three-credit courses that familiarize students with a variety of digital tools and methods through lectures offered by high-profile scholars and technologists, hands-on workshops, and collaborative projects. Students enrolled in the two-course sequence will complete their first year at the GC having been introduced to a broad range of ways to critically evaluate and incorporate digital technologies in their academic research and teaching. In addition, they will have explored a particular area of digital scholarship and/or pedagogy of interest to them, produced a digital project in collaboration with fellow students, and established a digital portfolio that can be used to display their work. The two connected three-credit courses will be offered during the Fall and Spring semesters as MALS classes for master’s students and Interdisciplinary Studies courses for doctoral students.

    The syllabus for the course can be found at cuny.is/dps17.

  • Categories

Skip to toolbar